How Nightlife Shapes New York City: An Analysis of Economics, Safety, and Mobility
Executive Summary
New York City’s nightlife shapes how people move, work, and experience safety after dark. Using data on noise complaints, crime, rideshare trips, and hospitality employment before and after COVID-19, we find that nightlife impacts concentrate in specific neighborhoods and late-night hours. Nightlife areas face higher noise complaints and predictable post-midnight crime spikes, but generate disproportionate nighttime travel and economic activity, often with lower crime per venue than dispersed areas. Nightlife is manageable when city services match these time-and-place patterns.
How Nightlife Shapes New York City: An Analysis of Economics, Safety, and Mobility
Introduction
New York City’s nightlife supports jobs, spending, and late-night movement, but brings neighborhood tradeoffs around noise and safety. To understand nightlife’s role in modern NYC, we examine how nightlife activity connects to quality of life, mobility, and public safety.
The 2019 NYC Nightlife Economy Report 2019 NYC Nightlife Economy Report established nightlife’s economic importance but focused on borough-level economics and predates COVID-19. We extend that work by linking nightlife to neighborhood experience, late-night travel, and crime timing before and after the pandemic.
We break the overarching question into five sub-questions:
- Noise: Do ZIP codes with more nightlife venues experience more noise complaints?
- Crime: Do crime rates rise around popular nightlife districts after midnight?
- Rideshare Mobility: How do rideshare trip volumes change by hour around nightlife zones?
- Employment: Who’s working while the city’s partying—and how did this workforce weather COVID?
- Post-COVID Mobility: Has COVID changed the way the city moves at night (8 PM–4 AM)?
These analyses connect nightlife to resident experience, city mobility, the night economy workforce, and public safety timing.
Data Sources and Methods
We combine multiple public datasets capturing venue locations, resident complaints, crime timing, nighttime movement, and employment.
Nightlife Venue Data:
- NY State Liquor Authority (SLA): Licensed premises data mapping nightlife venue clusters and distinguishing nightlife-heavy from residential areas.
- Yelp Fusion API: Venue information (bars, clubs, late-night restaurants) for nightlife density estimation.
Quality of Life and Safety Data:
- NYC 311 Complaint Data: Noise complaint records (2018–2024) at ZIP-code level.
- NYPD Complaint Data Historic (2019–2023): Crime incidents mapped to taxi zones for hour-by-hour analysis.
Economic and Mobility Data:
- TLC Rideshare Trip Records: Trip records comparing late-night demand across nightlife and non-nightlife zones.
- Bureau of Labor Statistics QCEW (NAICS 722): Quarterly employment data for Food Services & Drinking Places (2019–2023).
Geographic Reference:
- NYC Zip Code Boundaries and TLC Taxi Zone Shapefile: Spatial boundaries.
Data Limitations
Our analysis has key limitations: SLA and Yelp miss informal nightlife; 311 complaints reflect reporting behavior; NYPD data may undercount in some communities; TLC excludes walking, transit, and private vehicles; our 2019–2024 window captures COVID but not longer cycles. We triangulate across datasets to identify robust patterns.
Findings
Noise and Quality of Life
Do ZIP codes with more nightlife venues experience more noise complaints?
Link to Dolma’s individual report
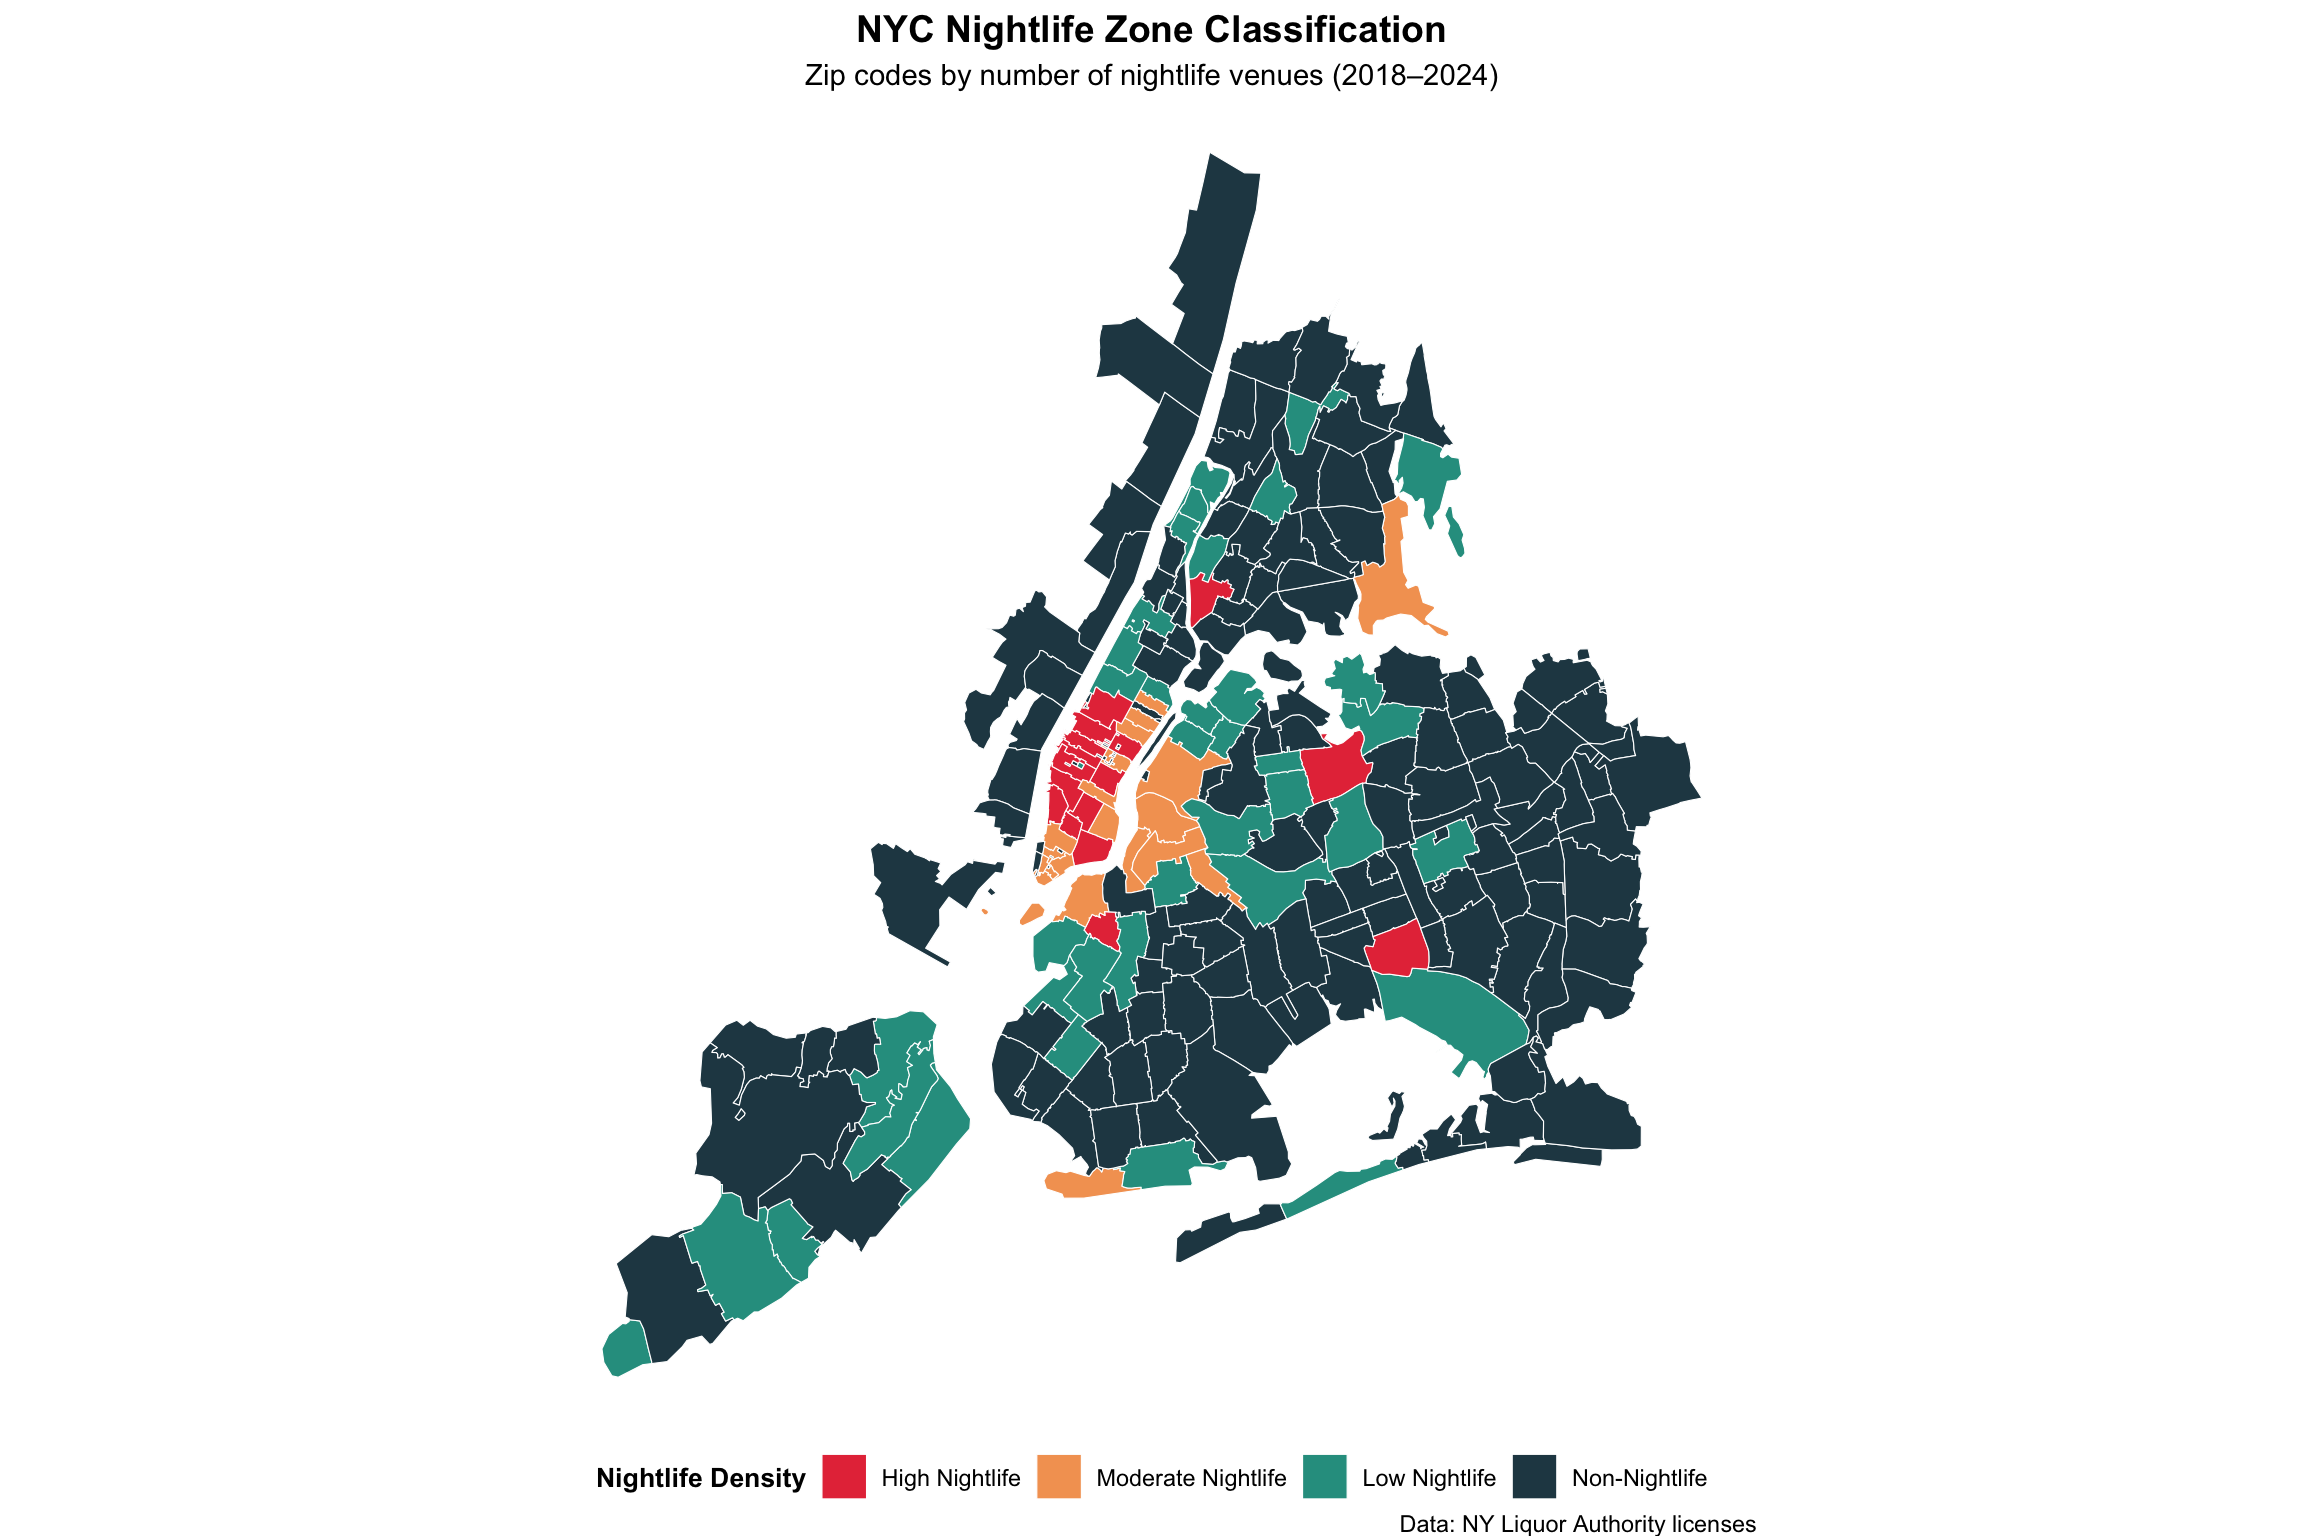
Figure 1: Distribution of licensed nightlife venues across NYC
Nightlife venues cluster in predictable hotspots—especially in Manhattan and parts of Brooklyn—creating the geographic foundation for the patterns we observe in noise, mobility, and safety.
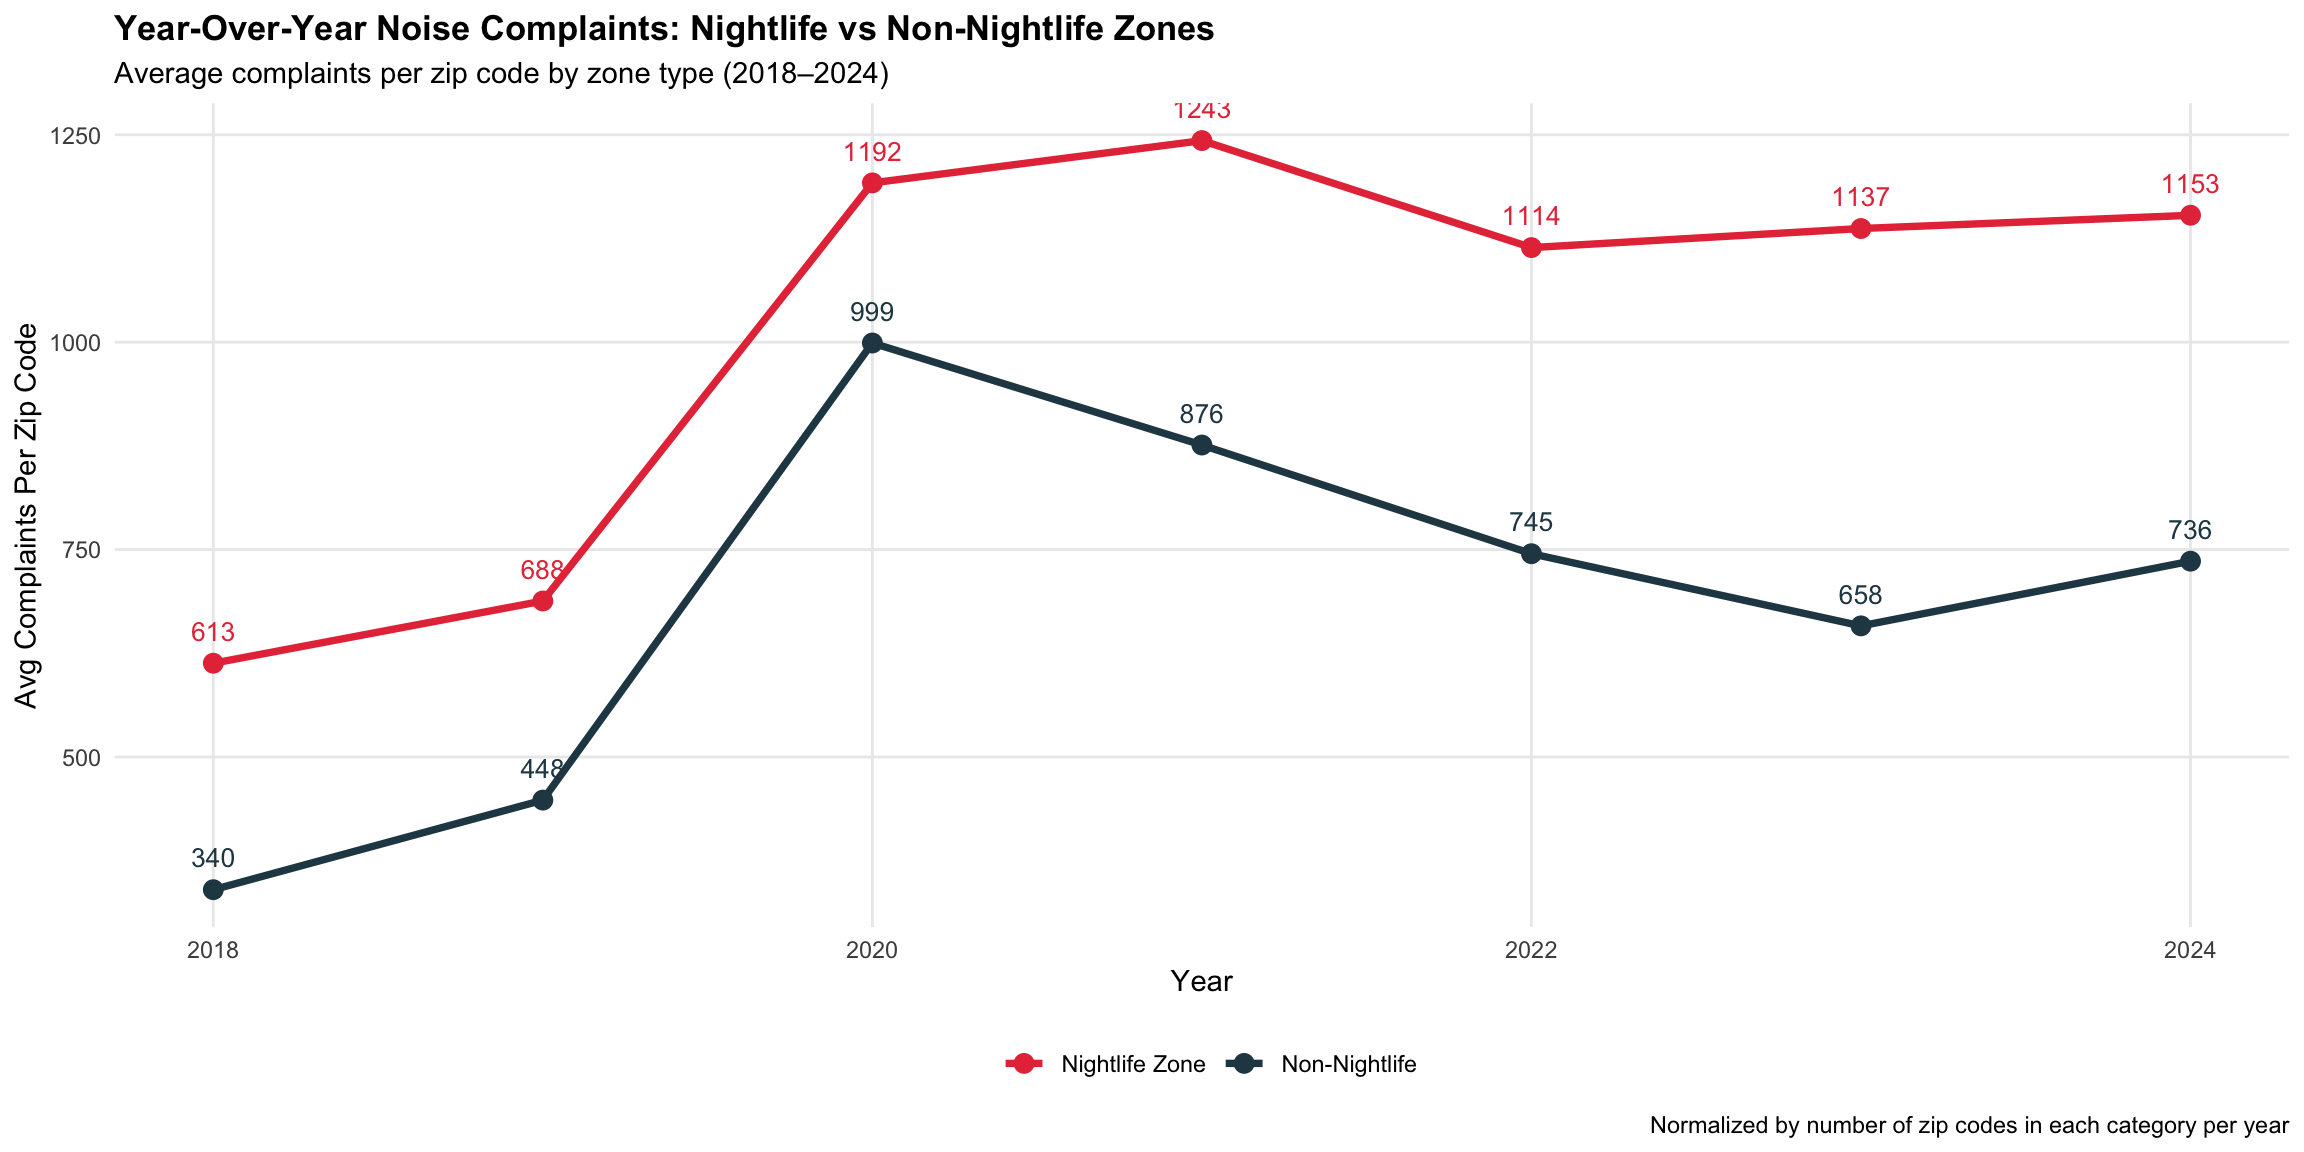
Figure 2: Noise complaints in nightlife vs. residential ZIP codes (2018–2024)
Across 2018–2024, nightlife-heavy ZIP codes consistently generate substantially more noise complaints than more residential ZIP codes, and the gap persists over time.
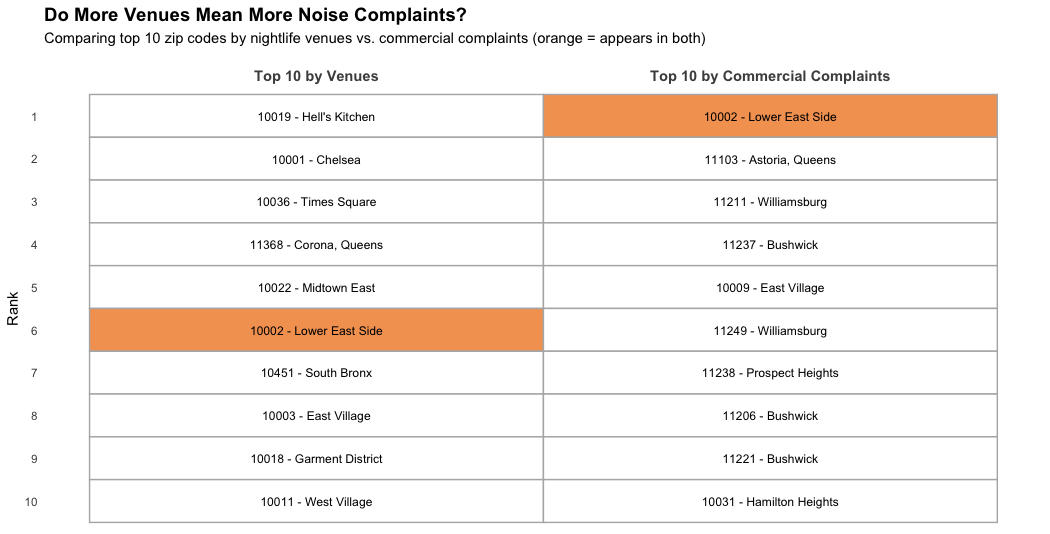
Figure 3: Top 10 ZIP codes by venue count vs. noise complaints
More venues don’t automatically mean more complaints. Some high-venue areas do not top the complaint list, while several neighborhoods with fewer venues generate the most complaints. One neighborhood appearing in both lists represents a useful “testing ground” for solutions where high venue concentration and high complaints overlap.
Nightlife-heavy areas face more noise complaints, but venue count alone doesn’t explain the pattern—venue type, neighborhood context, and reporting behavior also matter.
Crime and Public Safety
Do crime rates rise around popular nightlife districts after midnight?
Link to Richa’s individual report
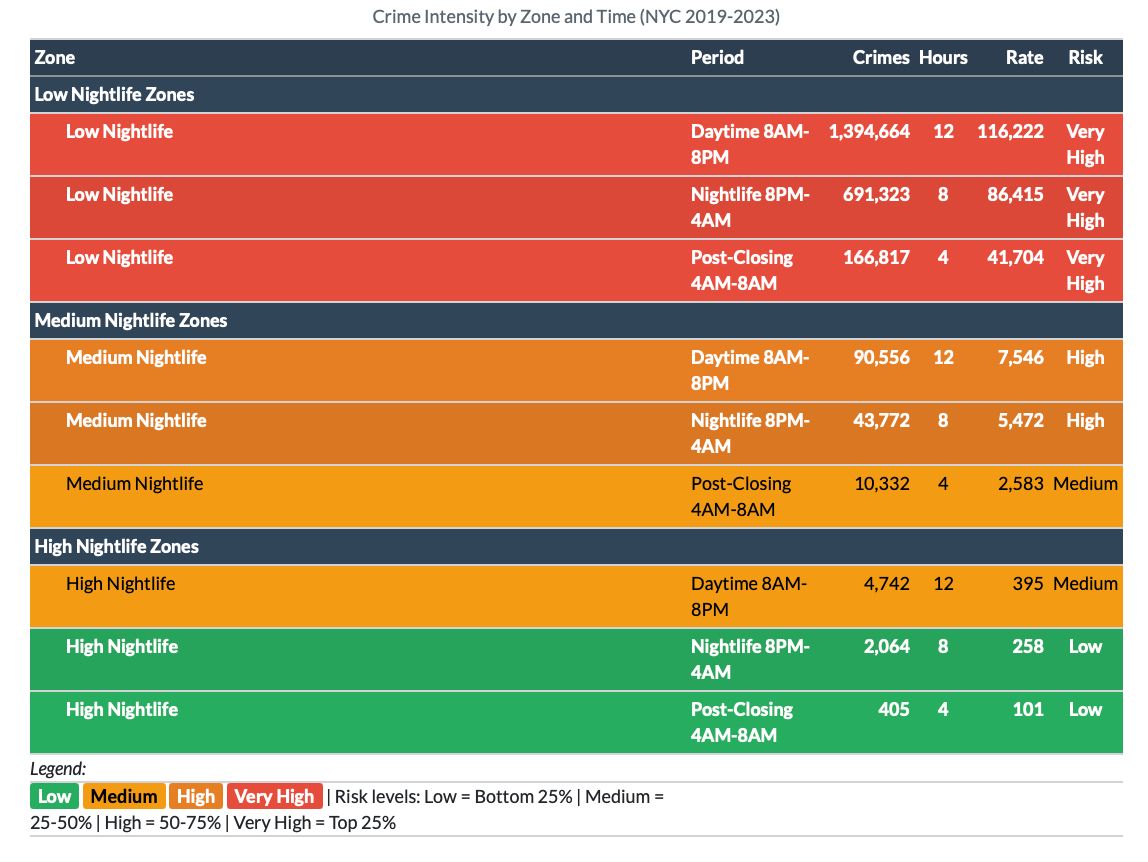
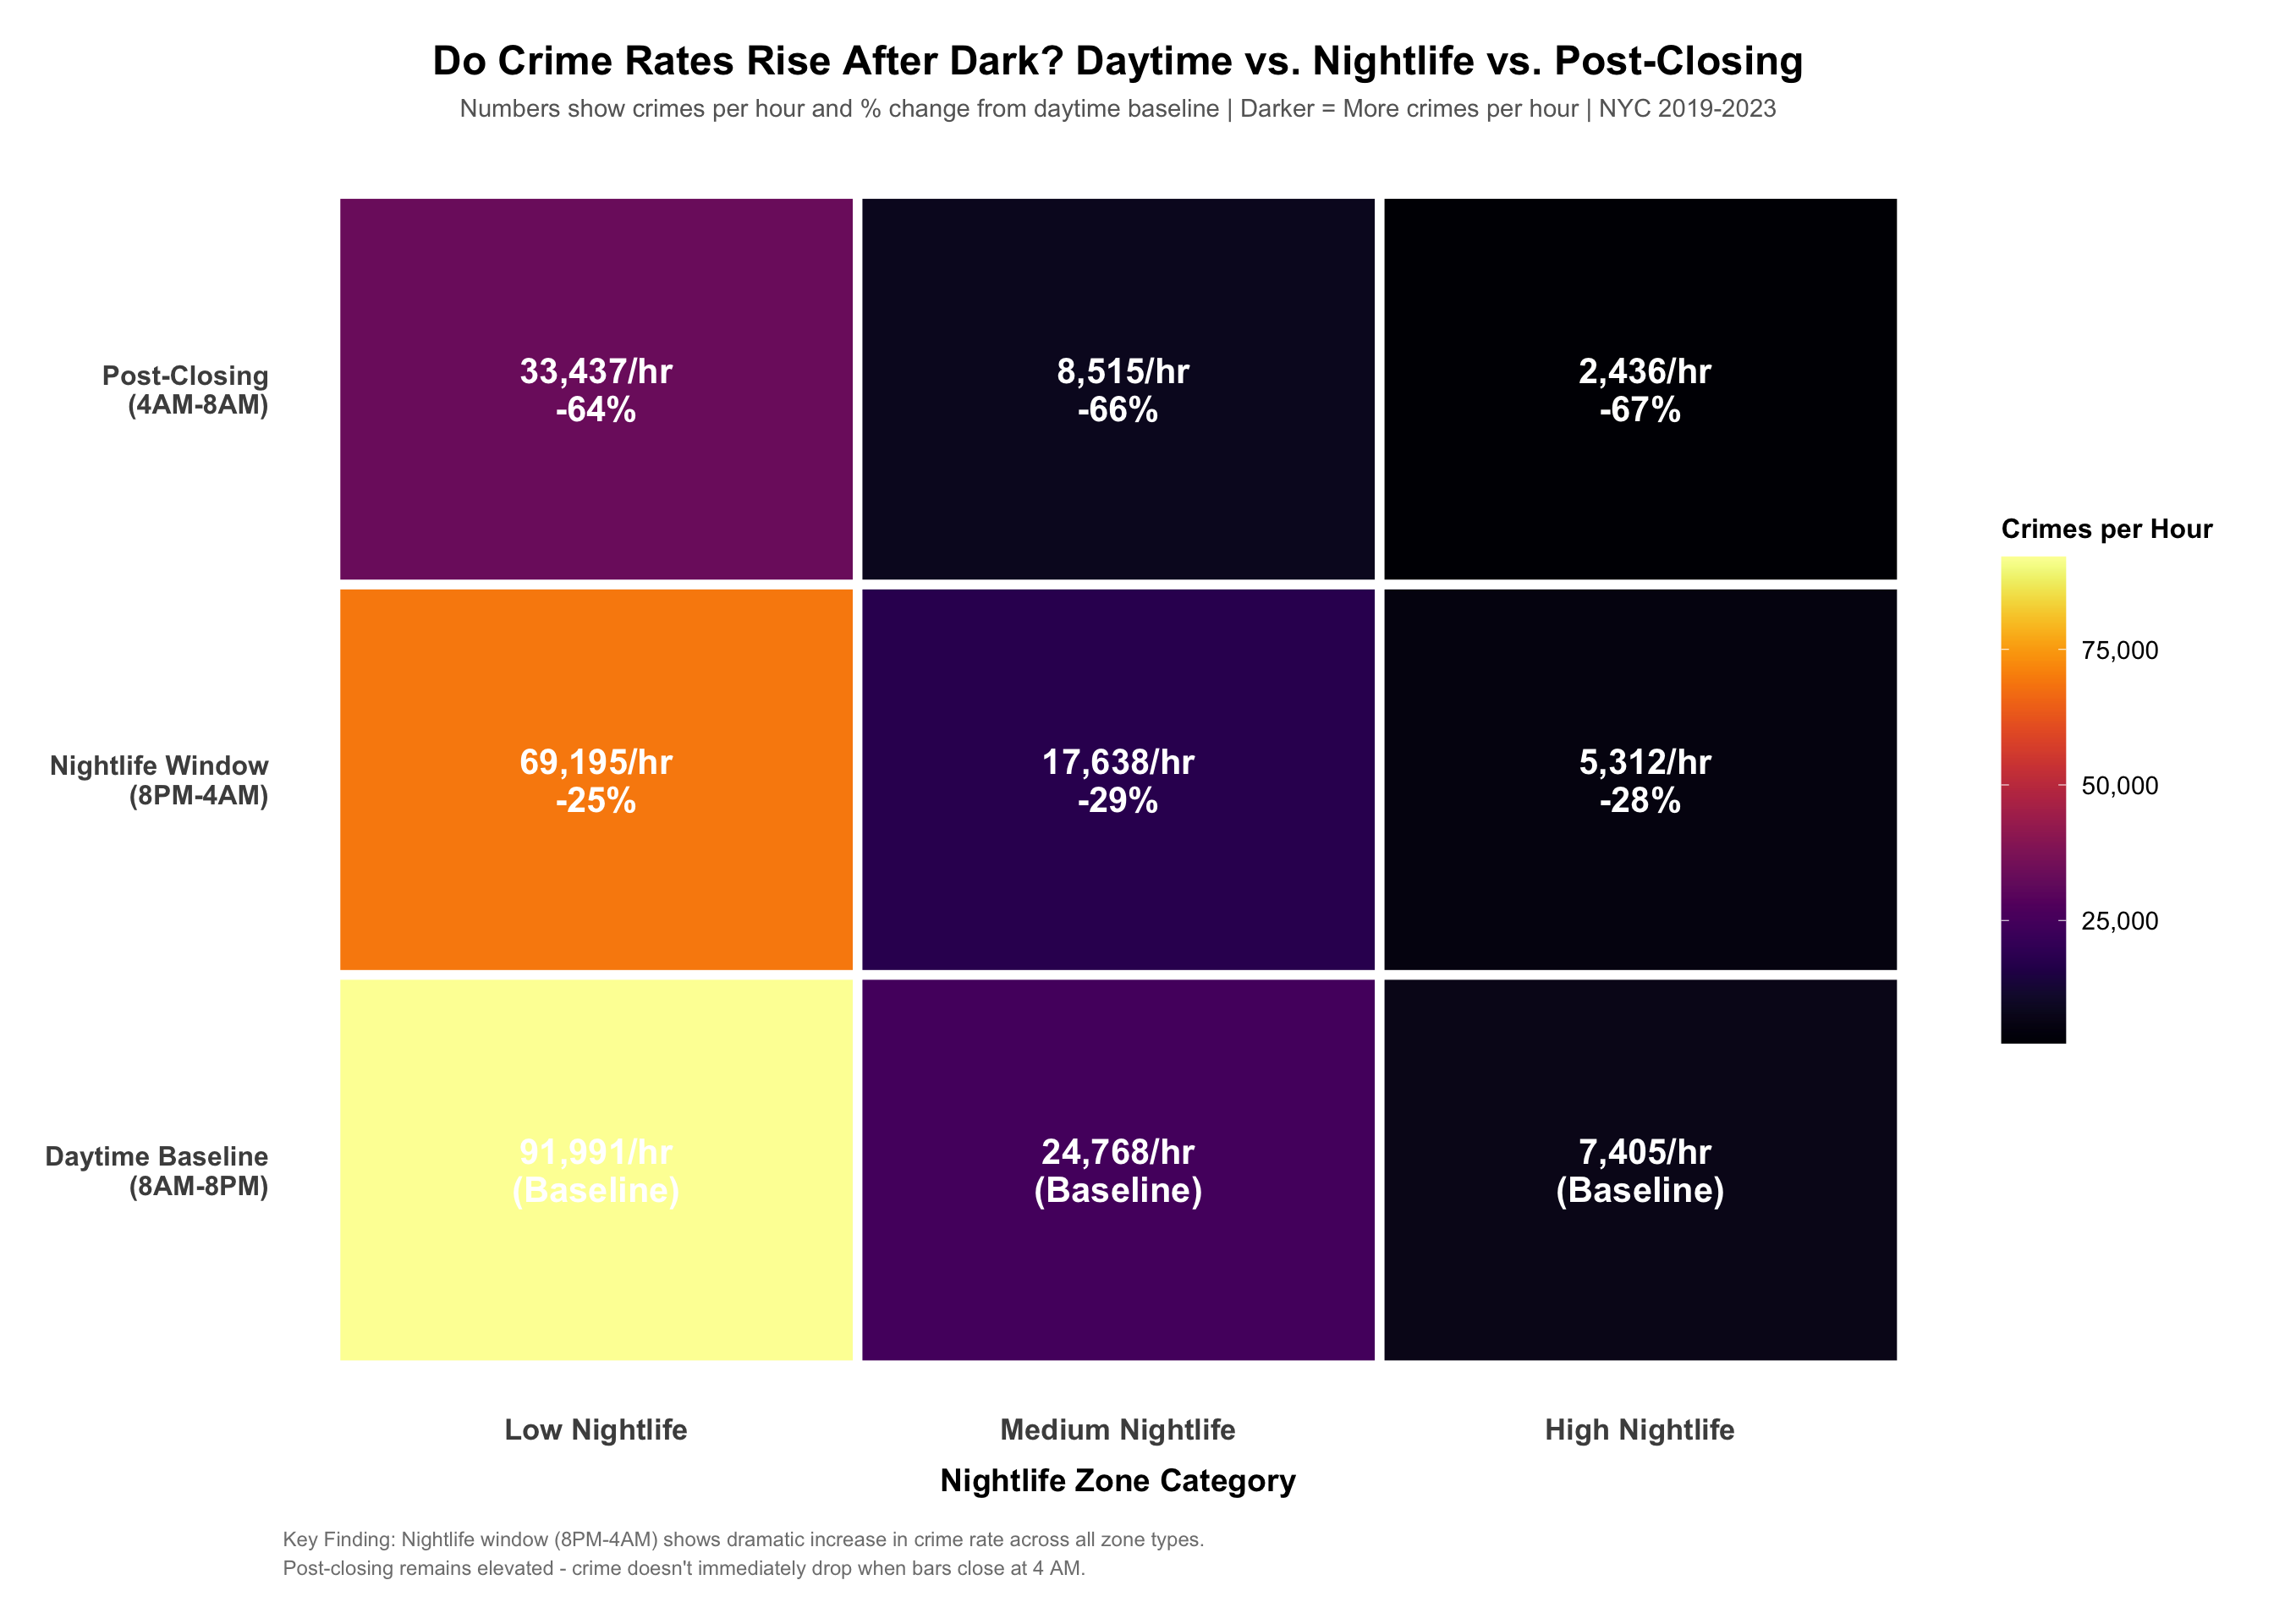
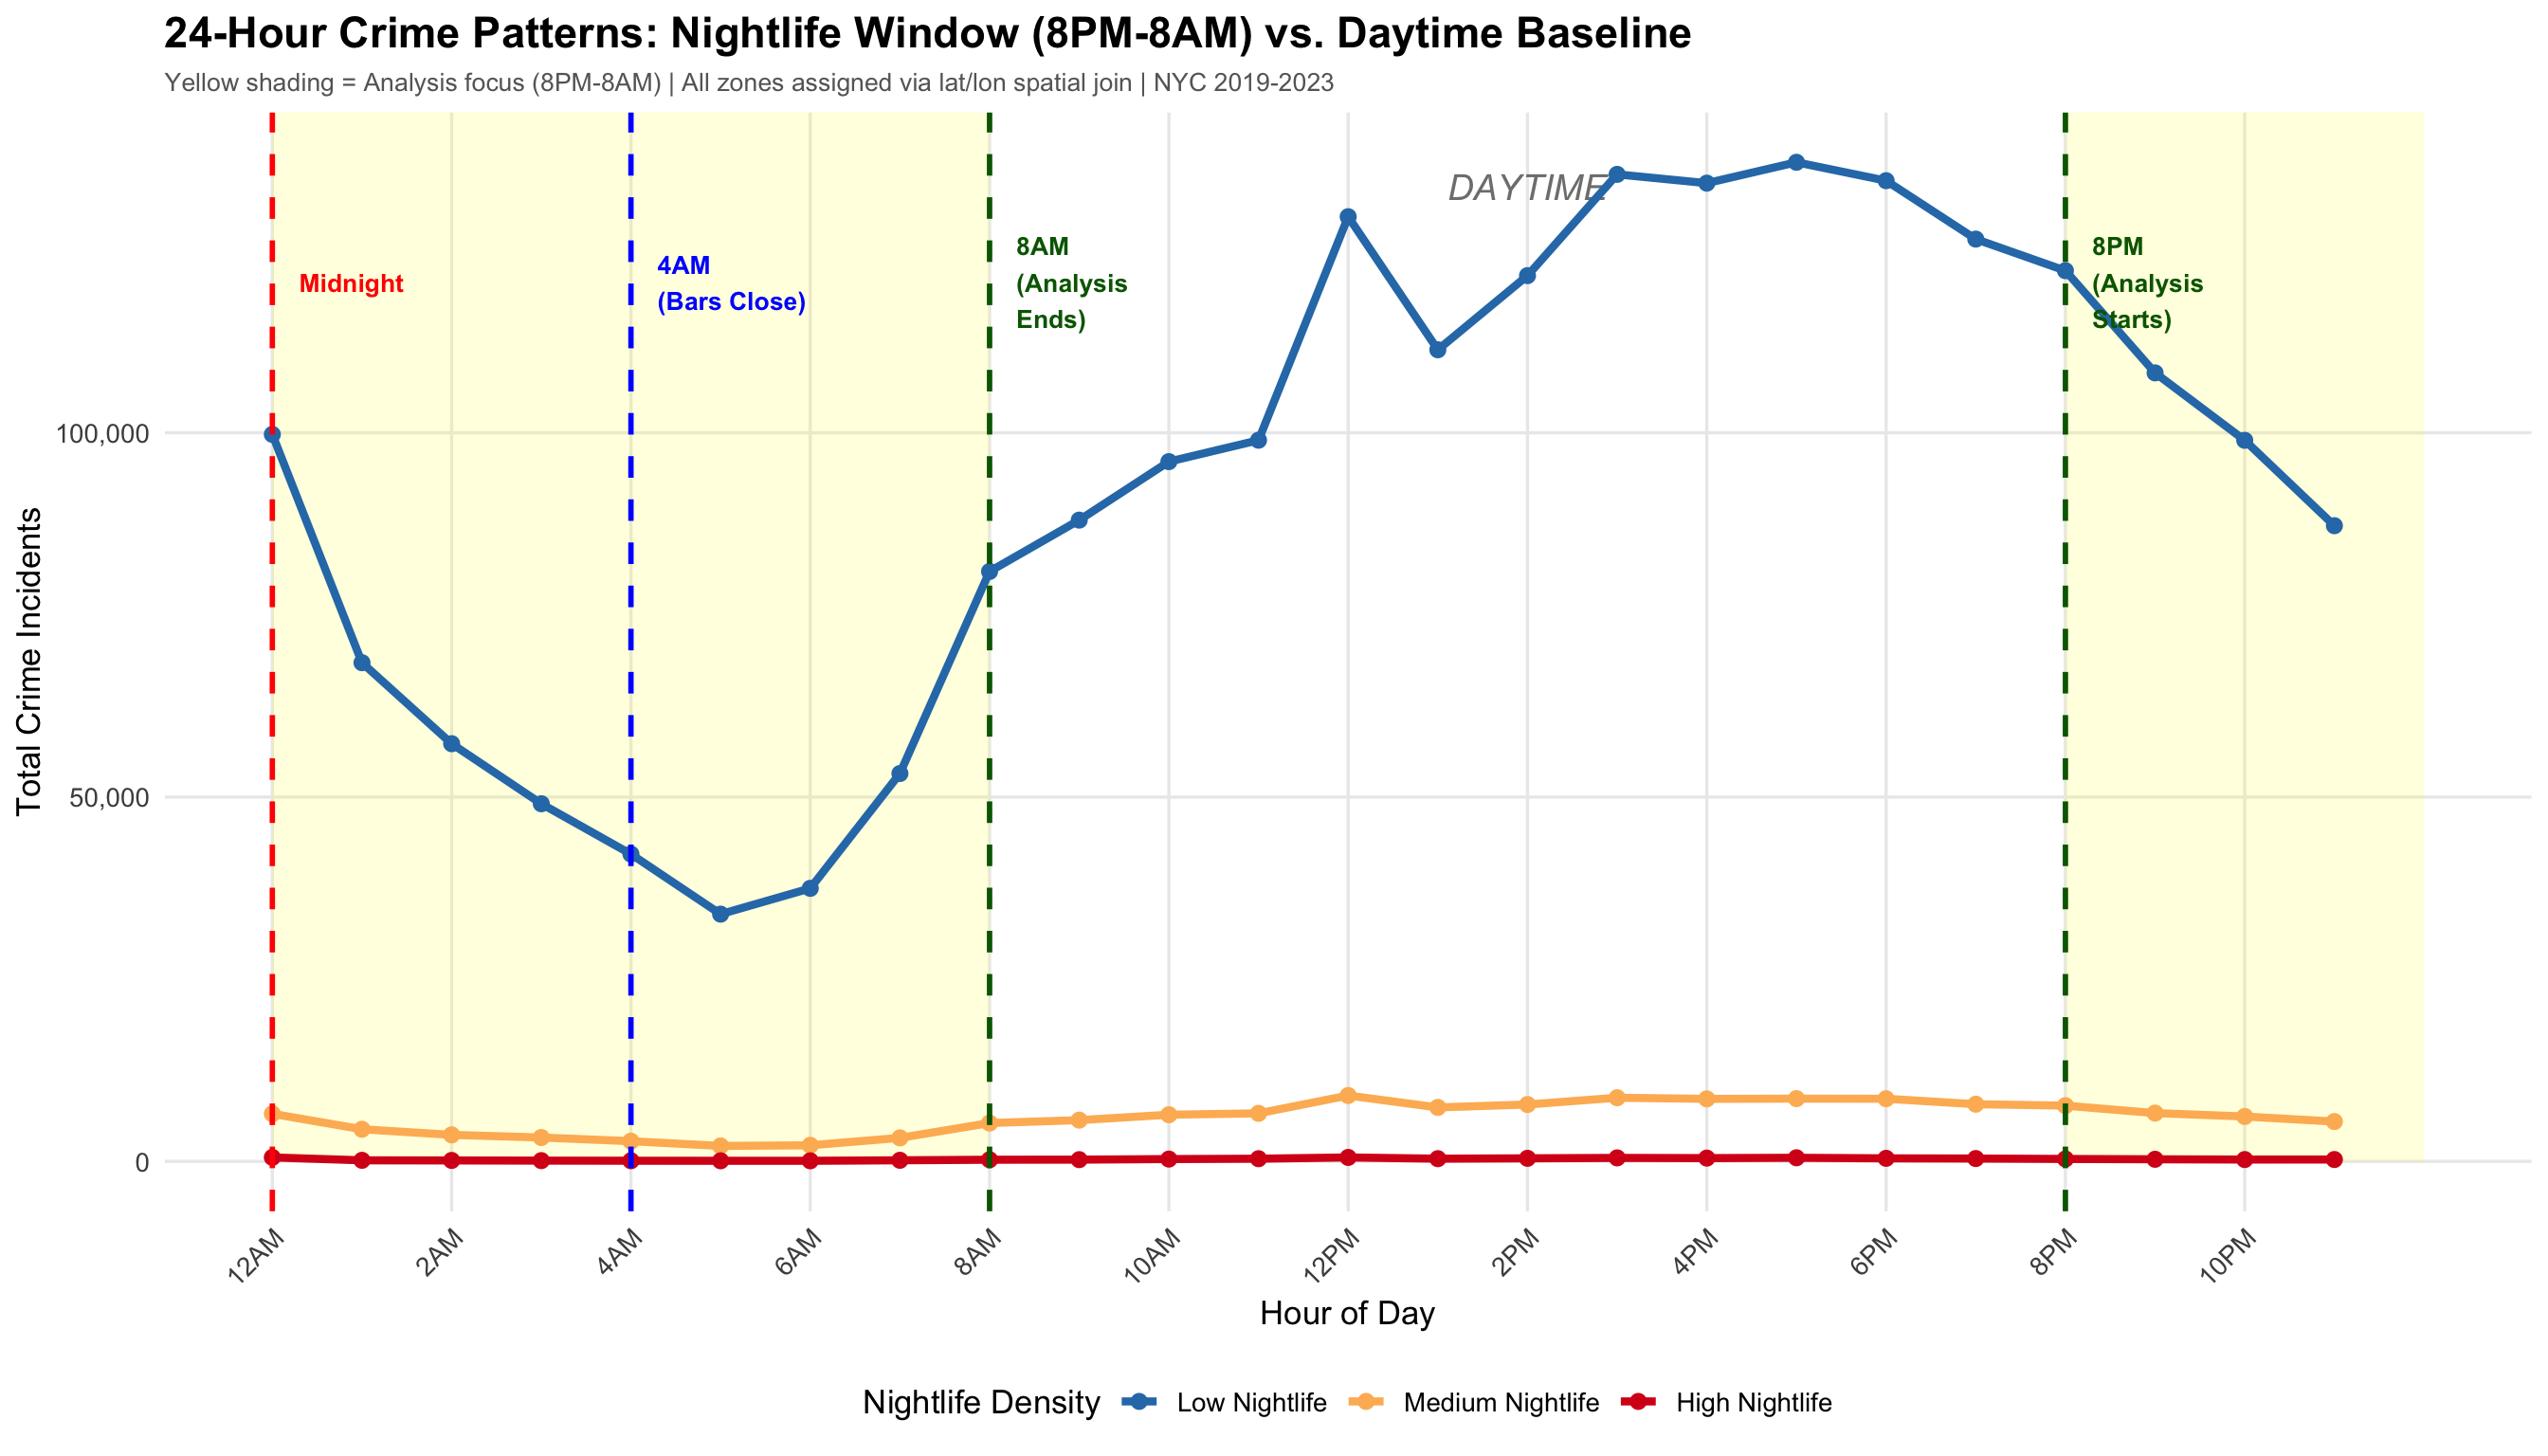
Figure 4: Crime patterns in nightlife vs. non-nightlife zones by hour
Crime is not uniformly higher in nightlife districts. Instead, it becomes more time-dependent: incidents rise 30-40% after midnight and fall sharply (32-44%) after closing time. This predictable timing supports targeted staffing during a narrow 4-hour window when risk peaks. Counterintuitively, high-density nightlife districts show lower per-venue crime rates than areas with dispersed venues, suggesting concentrated nightlife is more manageable than scattered alternatives.
Key Insight: Nightlife districts aren’t inherently dangerous—they are time-sensitive. With evidence-based allocation, the city can balance nightlife’s economic benefits with public safety.
Rideshare Mobility Patterns
How do rideshare trips change by hour around NYC nightlife zones?
Link to Hari’s individual report
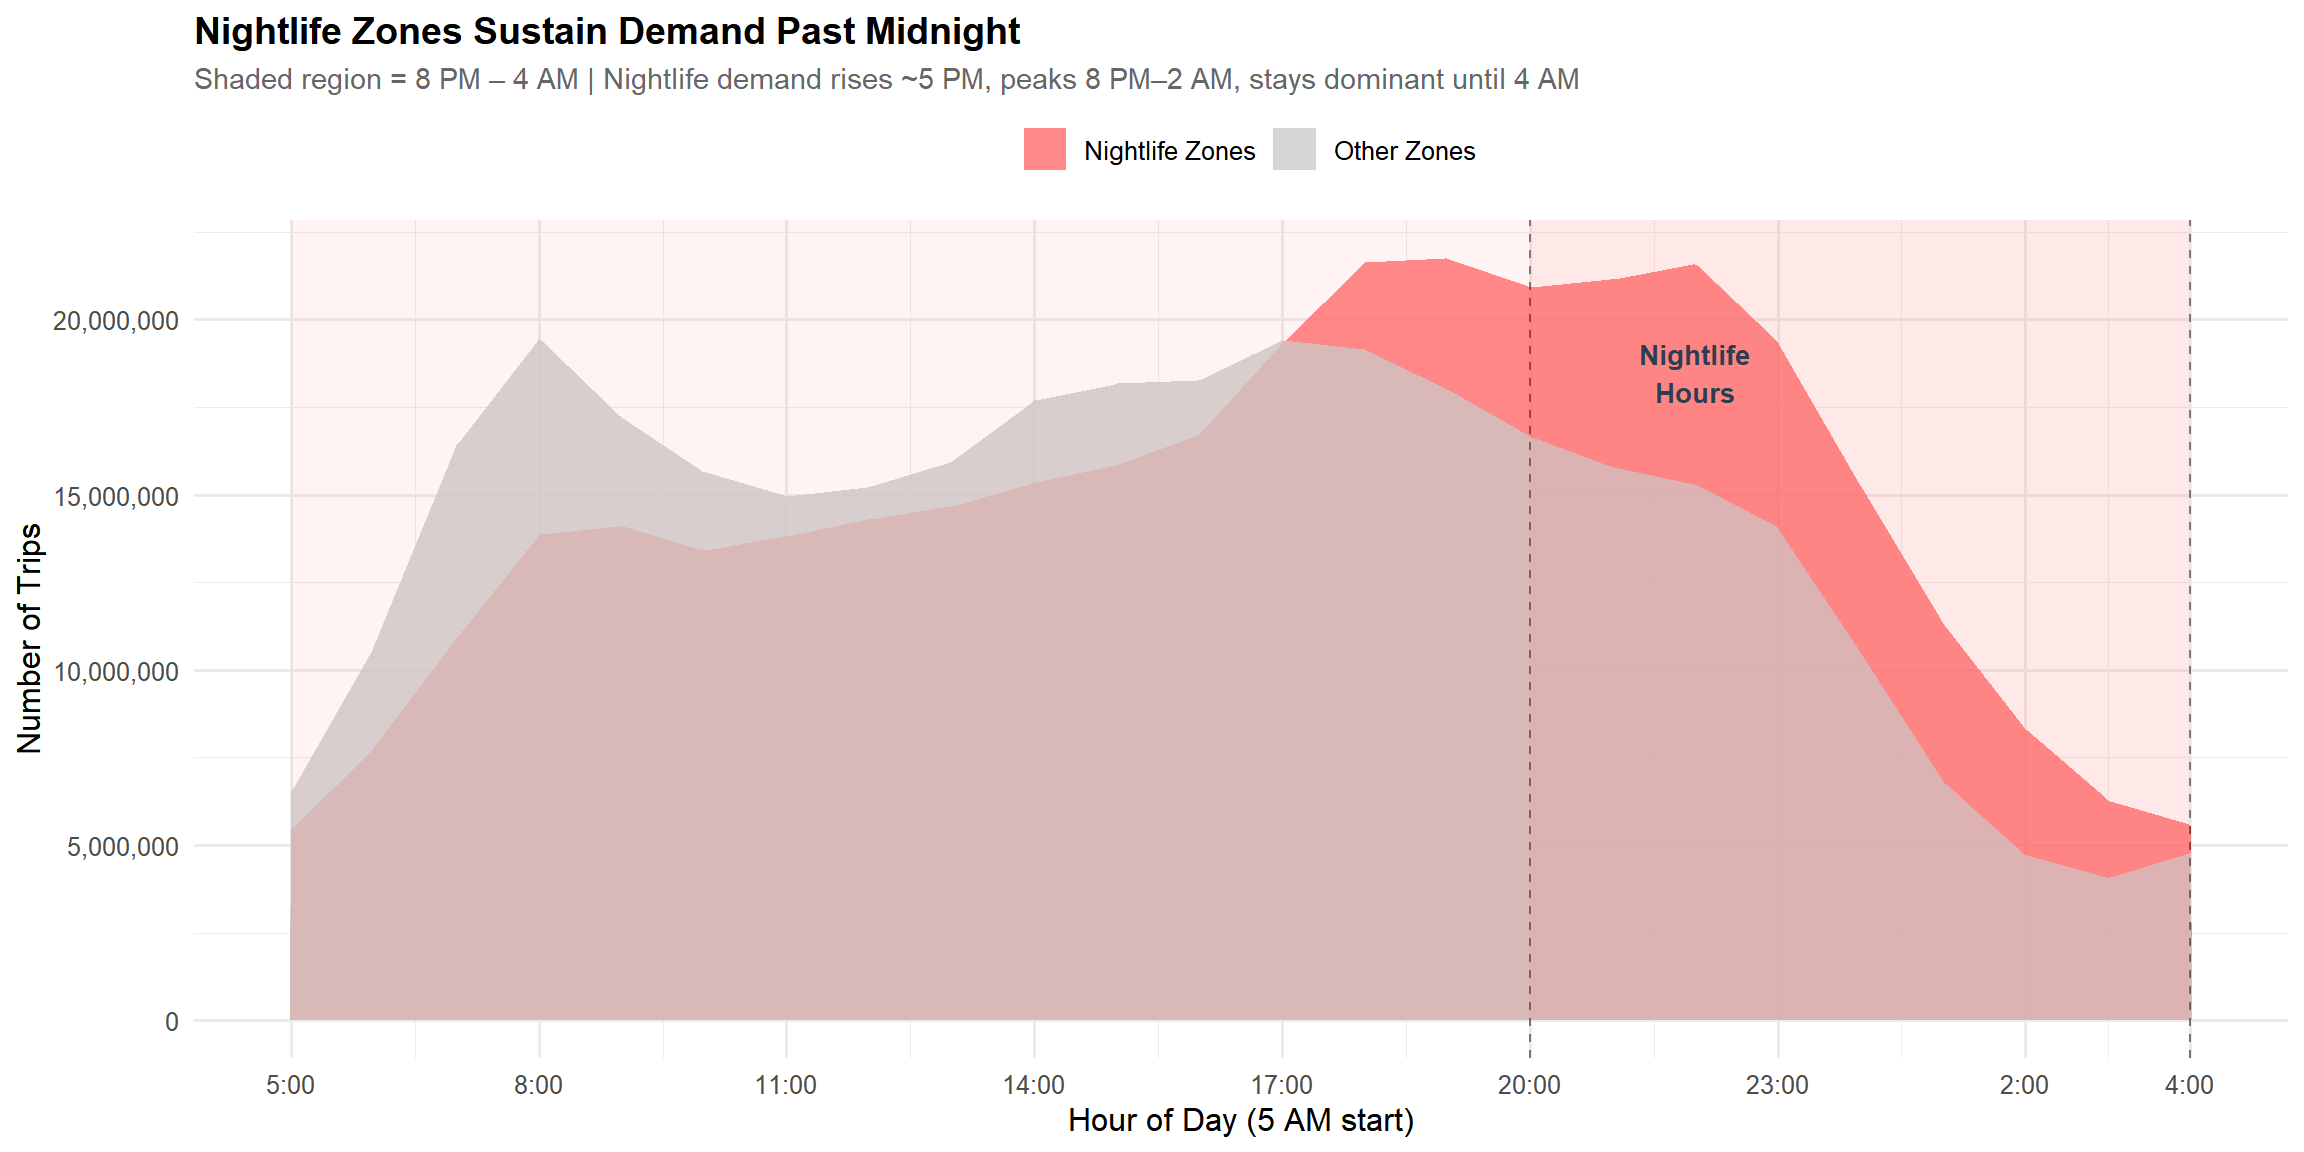
Figure 5: Nightlife zones sustain high rideshare demand late at night, while other zones drop off earlier
Trips rise and remain elevated deep into the night in nightlife zones, while non-nightlife areas decline earlier—showing how nightlife concentrates late-night transportation demand into specific zones and hours.
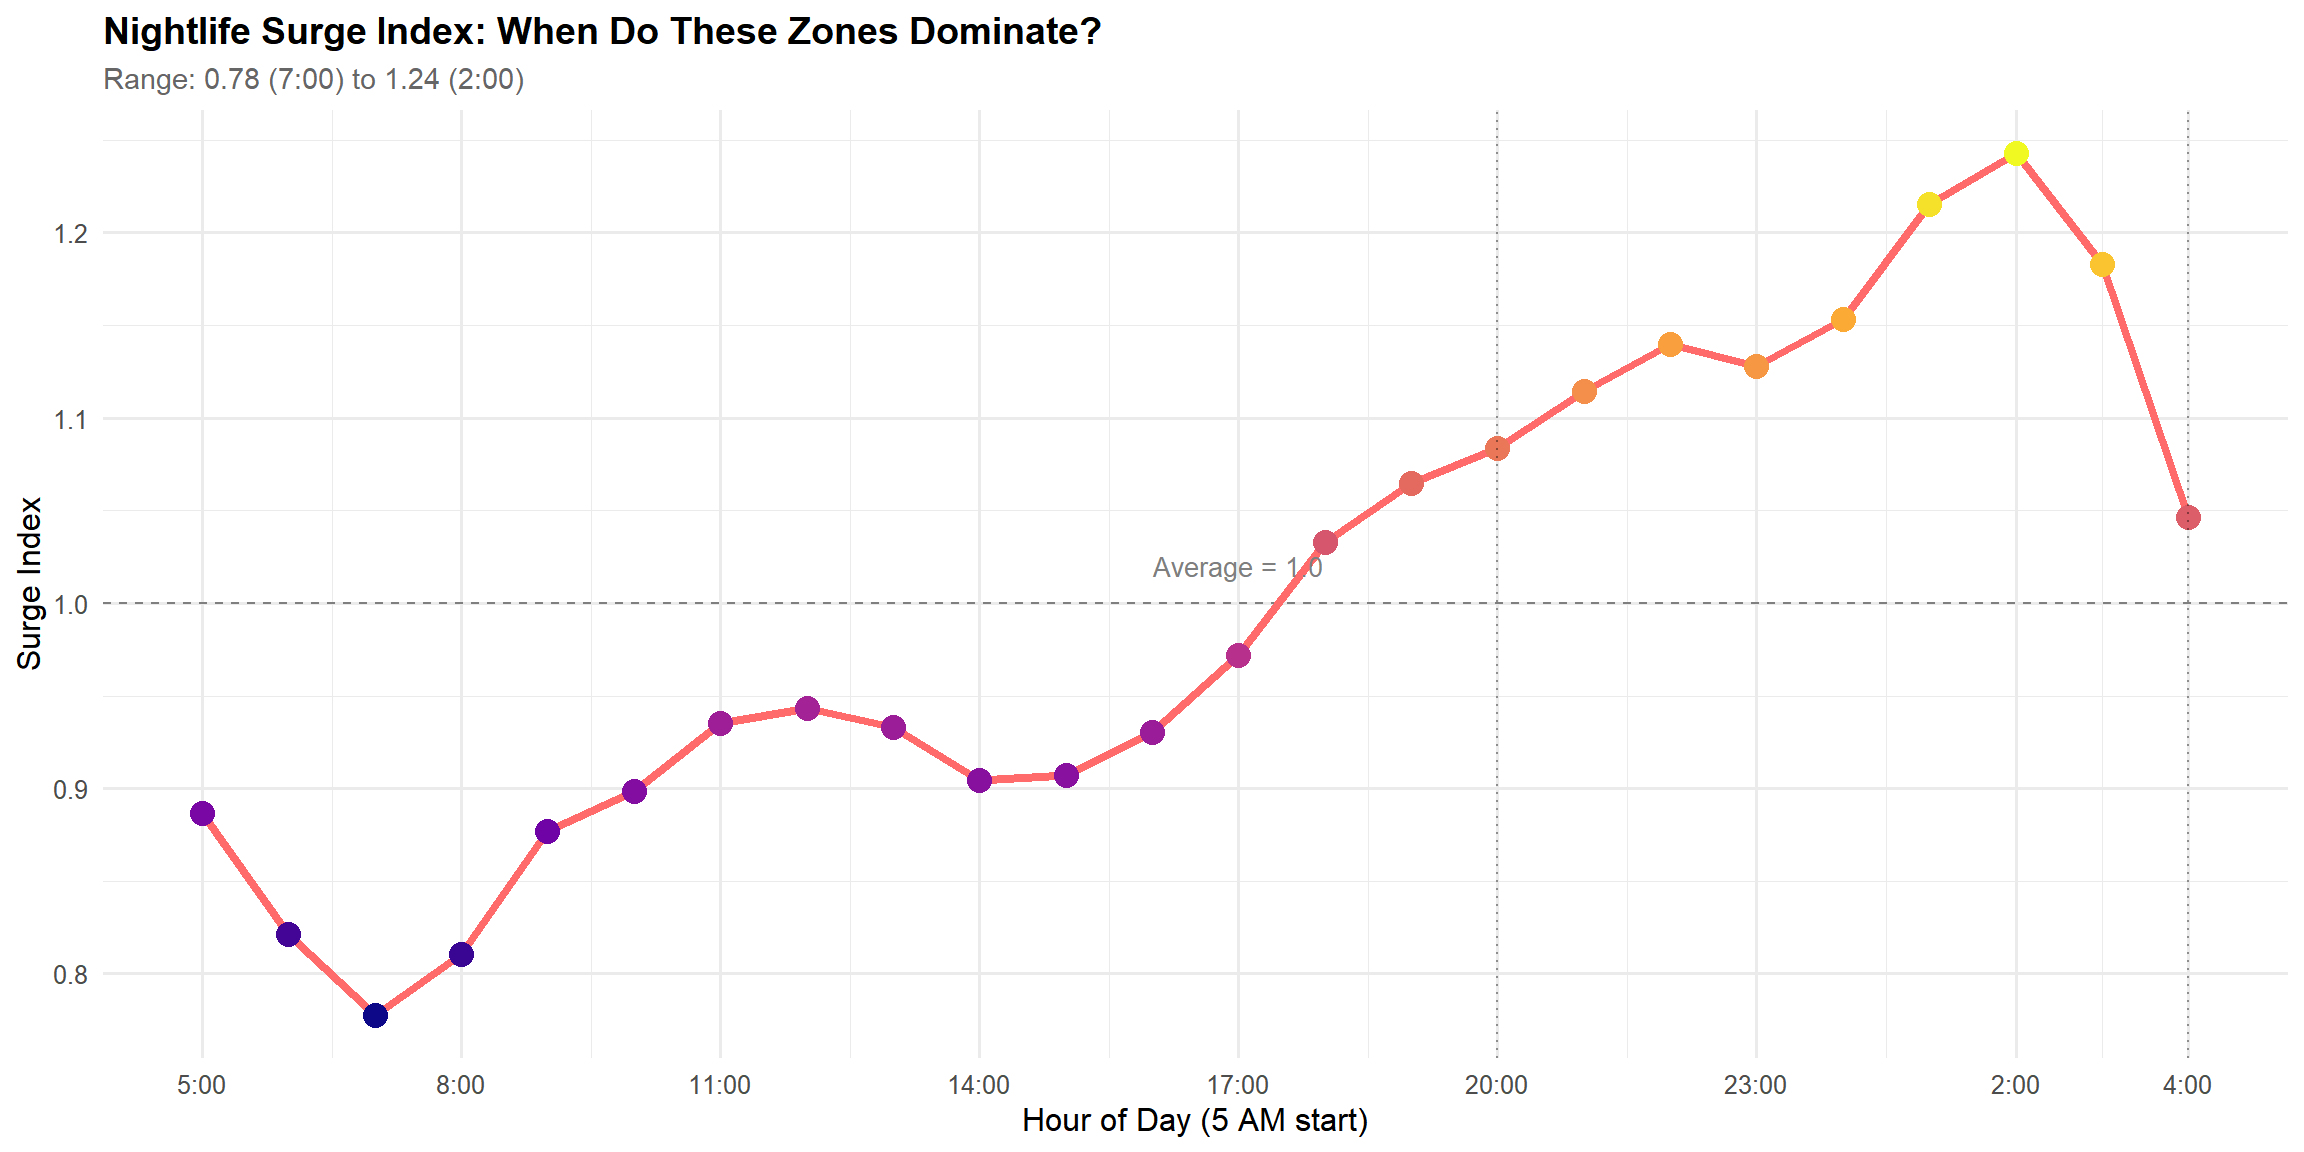
Figure 6: Surge index showing nightlife zone trip concentration by hour
The surge index shows when nightlife zones capture a larger-than-usual share of rideshare trips—peaking in the late-night window—helping quantify the timing of nightlife-driven mobility demand.
Nightlife Workforce and Employment
Who’s working while the city’s partying?
Link to Chhin’s individual report
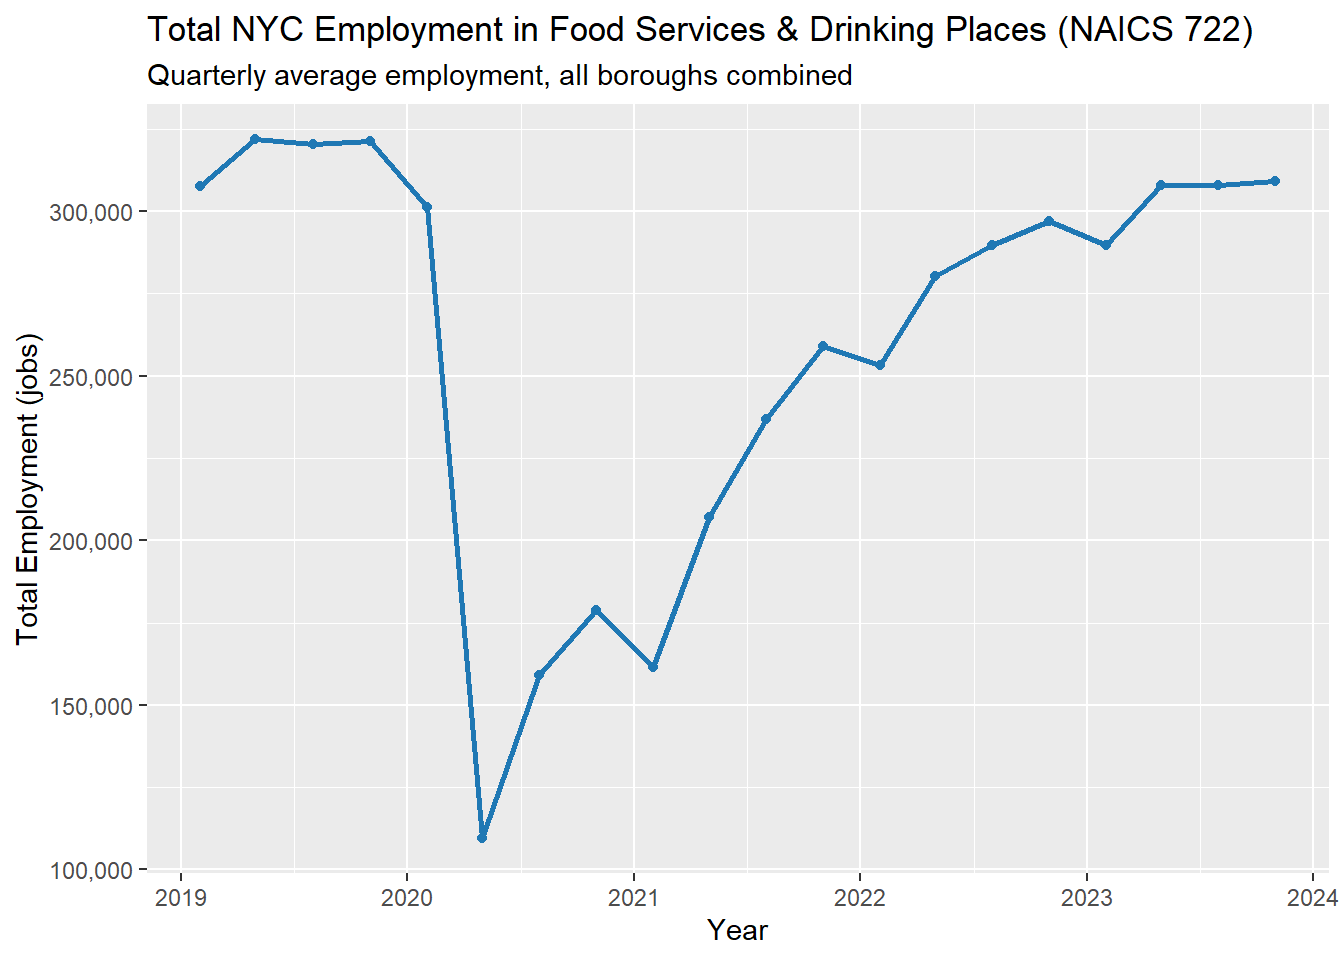
Figure 7: Quarterly employment in Food Services & Drinking Places (NAICS 722)
Hospitality employment fell sharply during COVID-19 and then recovered steadily, returning near pre-pandemic levels by 2023. This trend reflects both the vulnerability of nightlife-linked work to disruption and the sector’s capacity to rebound.
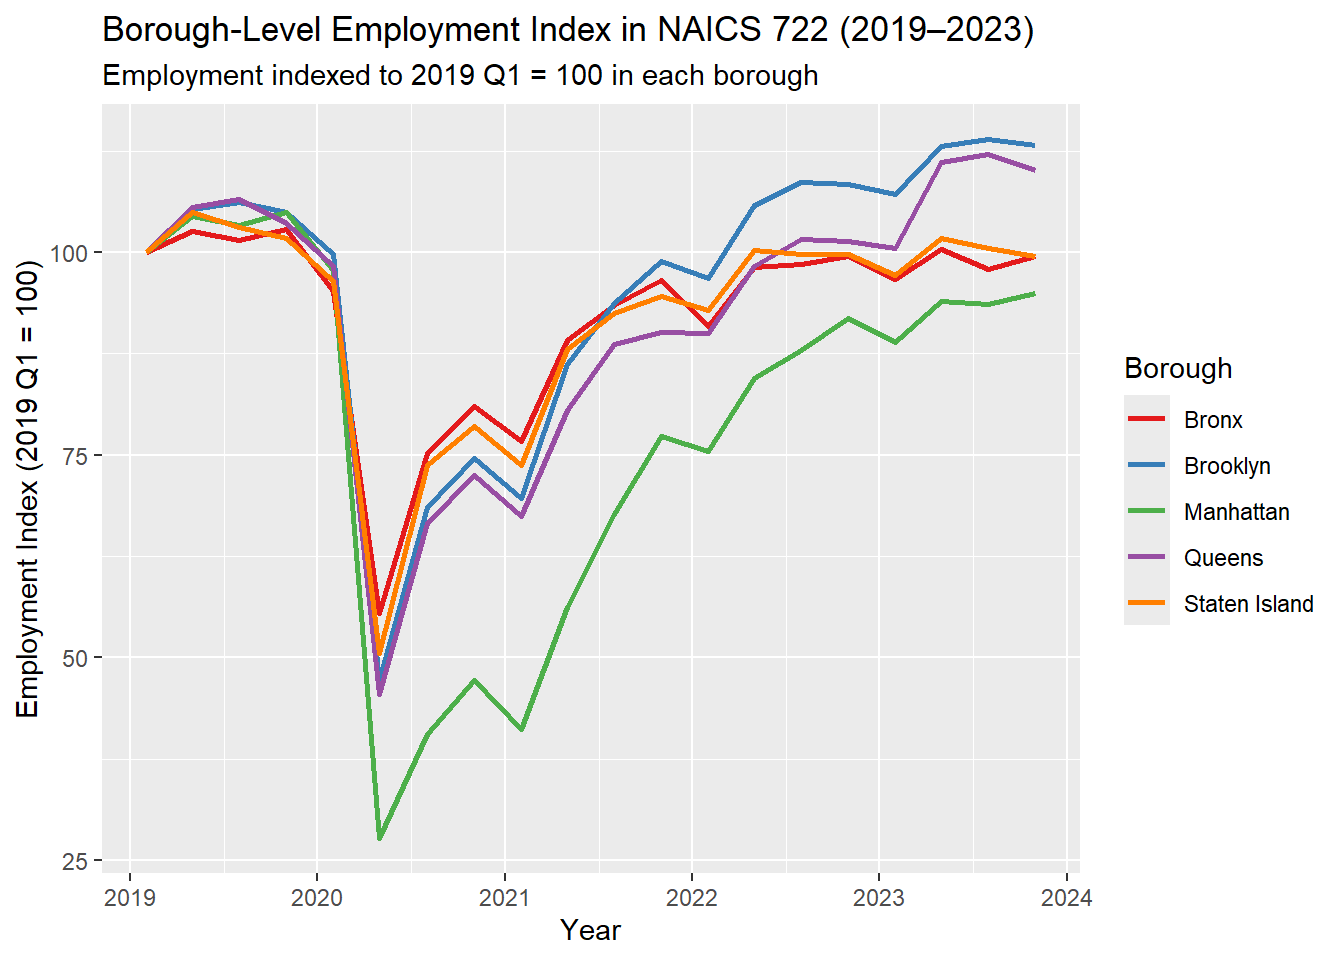
Figure 8: Borough-level recovery indexed to a 2019 baseline
Borough recovery patterns differed, with some areas experiencing deeper declines and slower rebounds than others. (See the individual report for borough detail.)
Together, these figures show that nightlife depends on a large workforce and that recovery was uneven across boroughs. Because many nightlife jobs cluster in Manhattan and Brooklyn, shifts in employment directly affect late-night mobility demand and neighborhood pressures—linking workforce stability to both economic vitality and quality-of-life outcomes. The 300,000+ workers who power nightlife venues also create “eyes on the street” during hours when residential areas go dark, connecting employment patterns to the safety dynamics examined in our crime analysis.
COVID’s Impact on Nighttime Mobility
Has COVID changed the way the city moves at night (8 PM–4 AM)?
Link to Apu’s individual report
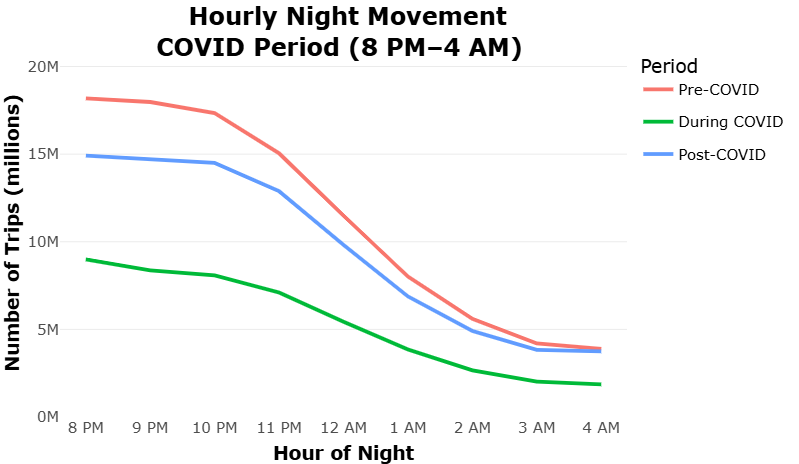
Figure 9: Nighttime trip volumes by hour across pre-COVID, during COVID, and post-COVID periods
Night travel dropped across all hours during COVID, especially late at night. Post-COVID travel rebounds, but the pattern shifts: activity peaks earlier (8-11 PM) and declines faster after midnight. This shift matters for workers, transit planning, and public safety resource allocation.
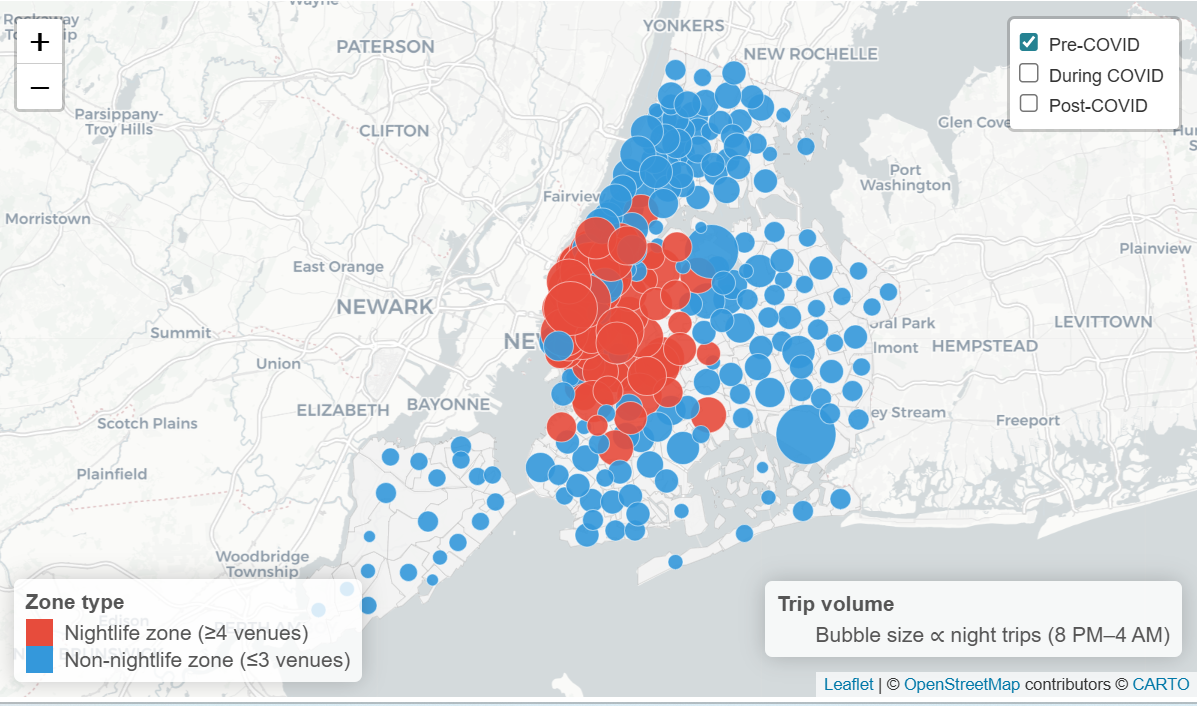
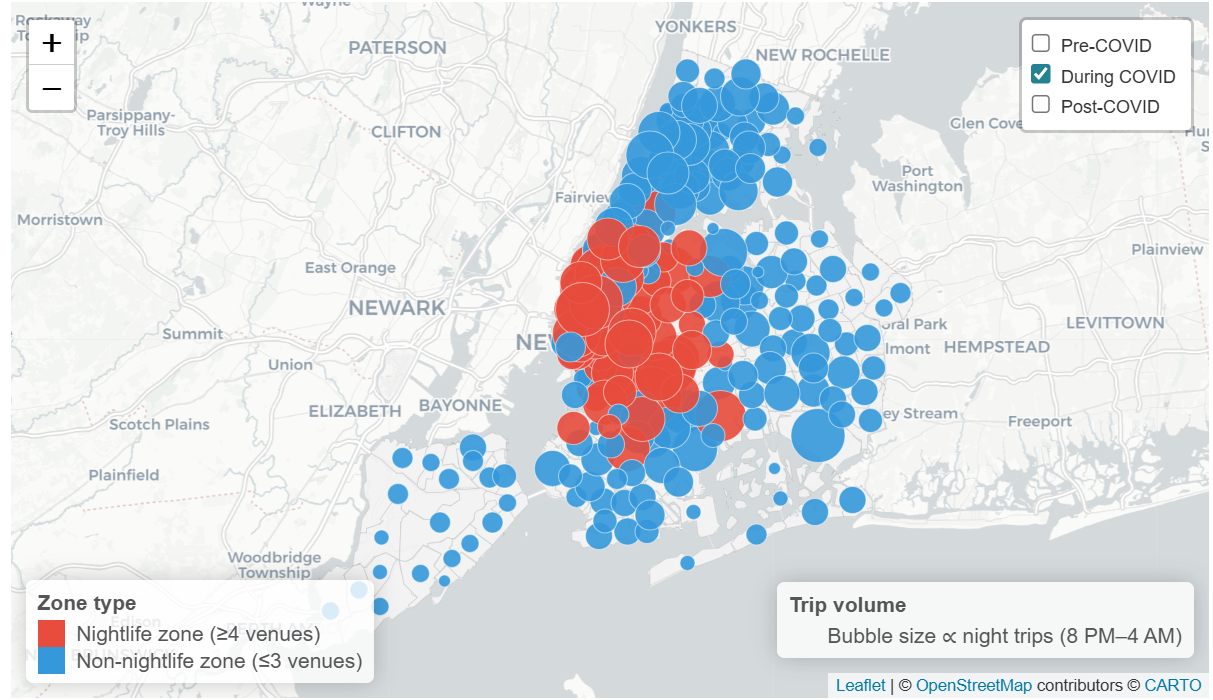
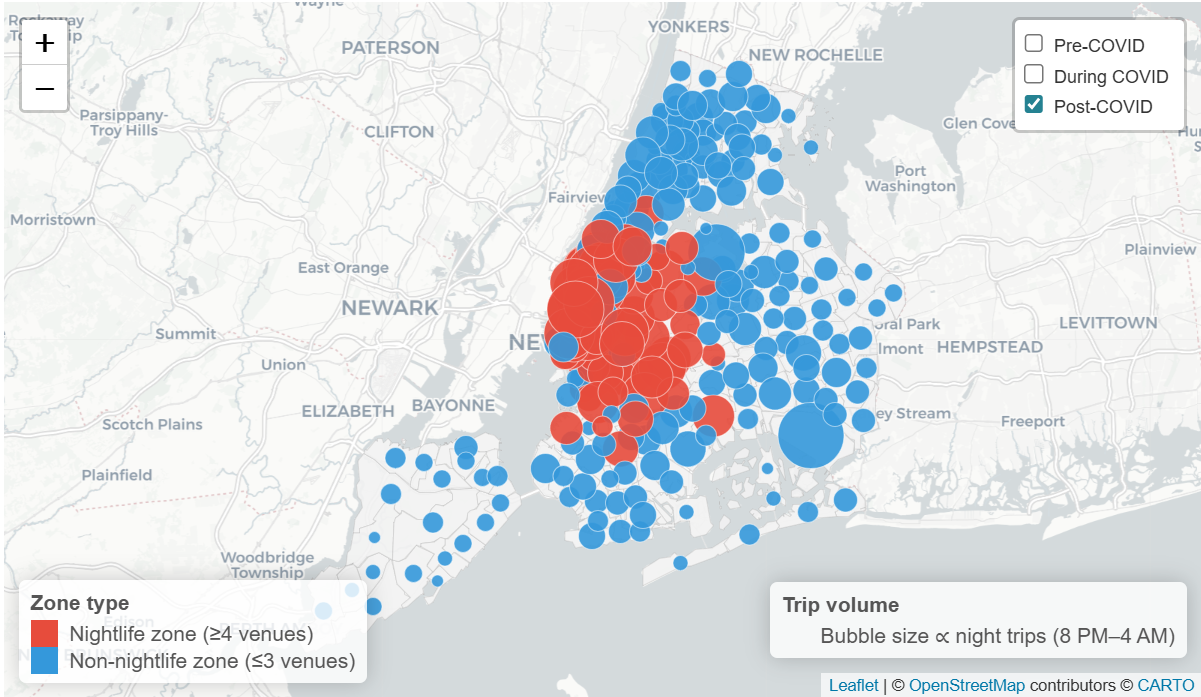
Figure 10: Geographic distribution of nighttime trips across periods
These maps show nighttime travel concentrating in Manhattan and Brooklyn nightlife zones pre-COVID. During COVID, trips collapsed citywide, with steepest declines in nightlife hubs. Post-COVID travel rebounds most strongly in those same hubs, reinforcing geographic concentration. This spatial pattern connects directly to employment clustering (Chhin) and explains why recovery in nightlife workforce and mobility moved in lockstep.
Synthesis: How Nightlife Shapes New York City
Our five analyses show nightlife as an integrated urban system: venue clustering affects resident noise experience, nighttime travel patterns, job concentration, and time-specific safety risks.
Quantifying the Nightlife Tradeoff
The 78 nightlife-heavy ZIP codes generate 1.5-1.8x more noise complaints while capturing 26% of nighttime rideshare revenue and employing 56% of Manhattan’s nightlife workforce. Crime spikes 30-40% after midnight but drops 32-44% after 4 AM closures—a predictable 4-hour intervention window.
The Nightlife Concentration Effect
A small set of nightlife-heavy ZIP codes drives outsized effects. These areas face higher noise complaints and predictable late-night crime spikes, but risk concentrates in specific hours rather than persisting all day. These same neighborhoods concentrate late-night travel demand, showing nightlife reshapes where the city stays active after dark.
COVID as a Natural Experiment
COVID disrupted employment, mobility, and activity patterns simultaneously. Recovery is substantial but shifted: post-COVID nighttime travel peaks earlier and drops faster after midnight, concentrating in established nightlife hubs where workforce recovery also concentrated.
The Venue Count Paradox
More venues don’t automatically mean more disruption. High-venue districts don’t always top complaint rankings, and concentrated nightlife shows lower per-venue crime than dispersed venues. Management quality, venue mix, and neighborhood infrastructure matter as much as venue count.
Answering the Overarching Question
How does nightlife activity impact New York City’s economy, safety, and quality of life?
Nightlife generates large economic and mobility benefits while creating concentrated, predictable neighborhood impacts—especially in a limited set of areas and late-night hours. Noise complaints are higher in nightlife-heavy ZIP codes, rideshare demand concentrates in nightlife zones after dark, and crime risk rises after midnight but falls sharply after closing time. Post-COVID, nighttime activity has rebounded but shifted toward earlier evening hours, which has implications for transit planning, staffing, and neighborhood management.
What This Suggests for City Planning
Our findings point to five practical, evidence-aligned next steps that match resources to where and when impacts occur.
1. Targeted Nightlife Zone Enforcement (8 PM–4 AM)
Crime concentrates after midnight and drops after closing; noise complaints are consistently higher in nightlife ZIP codes. Focus quality-of-life enforcement in nightlife hotspots during the 8 PM–4 AM window when impacts peak, rather than using uniform coverage across the day.
2. Enhance Late-Night Transit in Entertainment Districts
Late-night rideshare demand concentrates in nightlife zones, and post-COVID travel patterns shifted earlier. Improve transit frequency and coverage in high-demand nightlife corridors during peak hours to reduce rideshare reliance and improve worker and patron access.
3. Nightlife Workforce Support and Recovery Programs
Hospitality employment fell 65% during COVID and recovered unevenly across boroughs. Support workforce stability through portable benefits, emergency savings programs, and training pathways, targeting boroughs with slower recovery.
4. Concentrate Rather Than Disperse Nightlife
Venue count doesn’t map to complaints, and concentrated districts are more manageable than dispersed nightlife. Use zoning and licensing to favor well-managed nightlife districts while protecting residential areas, scaling infrastructure in established hubs.
5. Data-Driven Resource Allocation
Noise, mobility, and crime patterns follow predictable geography and timing. Build a dashboard combining 311 complaints, crime-by-hour, and trip patterns to guide staffing. Pilot in neighborhoods where multiple indicators overlap before citywide expansion.
Limitations and Future Directions
Data and Methodological Limitations
Our analysis relies on reported incidents (311, NYPD), which reflect reporting behavior and enforcement patterns. Venue data may miss informal nightlife; mobility data excludes transit, walking, and cycling; our 2019-2024 window captures COVID but not longer cycles. Findings are correlational—causality is influenced by density, policing, and venue management.
Future Research Directions
Future work could: (1) disaggregate crime types to match interventions; (2) expand mobility measures to include transit and pedestrian activity; (3) test policy pilots (enforcement schedules, transit changes, venue management); and (4) add qualitative research explaining why some districts manage nightlife better.
Conclusion
New York City’s nightlife is a system linking work, travel, resident experience, and public safety after dark. Nightlife’s impacts are real but concentrated and time-specific: noise complaints concentrate in nightlife-heavy areas, rideshare demand peaks late at night, and crime risk rises after midnight but drops after closing. COVID disrupted this system and left lasting shifts toward earlier activity concentrated in established hubs.
For city planning, nightlife is manageable when services match predictable geography and timing. Targeted enforcement, enhanced late-night transit, workforce support, and planning favoring well-managed districts can sustain nightlife’s economic benefits while reducing quality-of-life friction—helping the city that never sleeps do so safely and sustainably..